

Neil writes:
Given my last poster, I can't help but design my poster for #CogSci2017 thinking how I'm just going to turn it into pillows afterwards
This short (30 second) video shows the same data, plotted different ways:
D3 Show Reel from Mike Bostock on Vimeo.
Think about what your intuitive reaction is to these different plots. As I have said before, design is all about choices, and sometimes we underestimate how many choices we have in showing our data. You can find more about the data here.
I’m not sure what the difference between a fact box and an infographic is, but I’m intrigued by this article about the effectiveness of fact boxes. Hat tip to Hilda Bastien.
Speaking of infographics, there’s a whole gallery of them here.

Hat tip to Brett Favaro.
I have become obsessed with titles. This slide about headlines makes the point:

On average, five times as many people read the headline as read the body copy. When you have written your headline, you have spent eighty cents out of your dollar.
Hat tip to Barry Adams and Garr Reynolds.
I think I missed this paper on ways to improve data visualization.
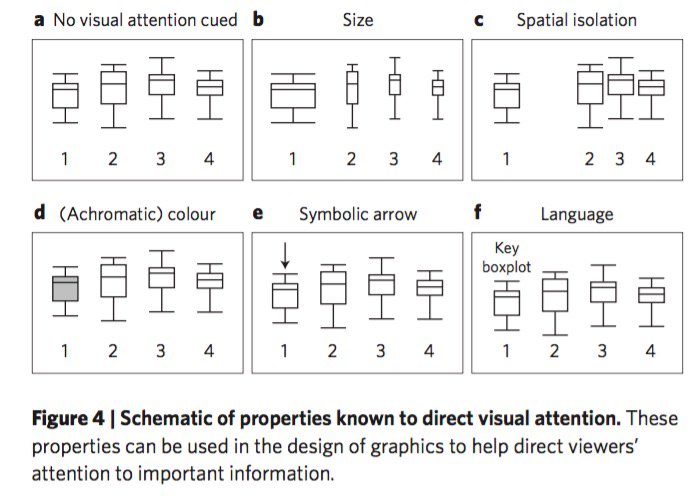
We review four key research areas to demonstrate their potential to make data more accessible to diverse audiences: directing visual attention, visual complexity, making inferences from visuals, and the mapping between visuals and language.
Hat tip to Jarrett Byrnes.
I think whoever made this graph might have benefitted from reading the aforementioned article:

What is going on with that Y axis!? Why is the Y axis on the left and right? Hat tip to Caroline Bartman.

There is a course on scientific illustration 20-24 November 2017 in Barcelona. The course will be taught in English by Julienne Snider, whose work is above.
I don’t drink. So this article’s point resonated with me:
(I)t’s worth thinking about who is excluded in academe when we found our conference conviviality on drink.Hat tip to Jon Tennant.
Type crime spotted by Ben Valsler, who notes, “Always consider how your layout will look from a variety of angles.”

Hat tip to Dr. Rubidium.
Nice set of typography tips. Hat tip to Ellen Lupton.
California state employees – including public universities – can’t travel to states that discriminate against LGBTQI communities using public funds. That includes for conferences. Simiarly, the Society for the Study of Evolution has struck several states out of consideration for hosting future meetings due to discriminatory laws. Hat tips to Janet Stemwedel and John McCormack.


No comments:
Post a Comment